The ECG findings of ischemia or infarction can result in changes to the QRS complex, J point, ST segment, and T waves. This makes the diagnostic process challenging in some patients because there are other diagnoses that will also change the J point, ST segment, and T waves, including:- early repolarization
- pericarditis
- left ventricular hypertrophy (LVH) with repolarization abnormalities
- left bundle branch block (LBBB)
- ventricular rhythms
- electronically paced rhythms
- drugs (digoxin is a common example)
- electrolytes (potassium is a common example)
- cerebrovascular accident (in other words, a stroke)
- others
Therefore, in order to accurately diagnose ischemia or infarction, you need to also know the diagnostic criteria of the diagnoses that mimic ischemia and infarction. If you do not know these diagnoses, you are at risk of making a false positive diagnosis (you think it is ischemia or infarction and it is not).
Ischemia is a condition of oxygen deprivation that does not result in cell death. Infarction is a condition of oxygen deprivation that does result in cell death.
Electrophysiology:
Before jumping into the diagnostic criteria of infarction, let's explain some electrophyisoiology concepts first.
Remember that oxygen is required for ATP and that ATP is required for pumping ions across concentration gradients and that concentration gradients are required for the generation of action potentials and voltages. Remember also that a higher voltage causes a taller waveform on the ECG. Putting these details together, it should not a big surprise that the voltage height of the QRS complex will be reduced with infarction because many cells will be too hypoxic (or dead) to generate an action potential. Therefore, the amplitude of the upgoing portion of the QRS (the R wave) will be reduced.
As the upgoing R wave is further and further reduced, it will ultimately disappear. When this happens, there is no upgoing waveform (R wave) to initiate the QRS complex. Instead, a downgoing waveform will initiate the QRS complex and this is called a Q wave.
Just as depolarization will be affected by infarction, repolarization will also be affected. Therefore, we would predict that T wave abormalities will occur with infarction.
Because there are usually 3 main arteries supplying the heart, blockage of just 1 vessel will cause "regional" injury. For this reason, one of the diagnostic features of infarction is that the ECG changes often occur in "regions" of the ECG, as opposed to simply "everywhere" on the ECG.
Another concept is the "current of injury". Action potentials and therefore the voltages inside the injured cells will be different than the non-injured cells. This means that one region of the myocardium will have a higher or lower voltage compared to nearby myocardium. When there is a difference in voltage, there will be a current. When there is a current, there will be a deflection on the ECG. In areas of the ECG that are normally isoelectric, such as the ST segment, ECG deflections can occur during infarction. Usually there is no current during the ST segment and the ST segment is isoelectric, but with infarction, the ST segment can be elevated or depressed, indicating that there is an active current.
So in a quick summary, with infarction, we will be looking for changes to the QRS complex due to abnormal depolarization, the ST segment due to the currents between injured and non-injured cells, and the T wave, due to abnormal repolarization. Keep these mechanisms in mind when you read the following sections.
ECG diagnostic criteria of myocardial infarction:- peaked T waves (one of the earliest findings)
- J point and ST segment elevation
- "reciprocal" J point and ST depression
- reduced R wave amplitude
- Q waves
- above findings occur in 2 anatomically contiguous leads (2 leads from the same area of the heart)
- loss of R wave progression
- QT prolongation
Some special specific diagnostic patterns:- ST segment elevation in aVR plus ST depression in > 8 other leads (suggest left main occlusion or multi-vessel occlusion)
- deeply inverted T waves V2-4 plus QT prolongation (suggests left main occlusion or cerebrovascular accident)
J point elevation:
Normal threshold values are measured in either millivolts (mV) or millimeters (mm). 0.1 mV = 1 mm. Normal values are:1 | | V2-3 | All other leads |
| Male, > 40 years | 2.0 mm | 1.0 mm |
| Male, < 40 years | 2.5 mm | 1.0 mm |
| Female | 1.5 mm | 1.0 mm |
ST segment elevation:
This is a finding that is present is pericarditis, early repolarization, LBBB, and LVH with repolarization changes. Therefore, the simple present of ST segment elevation is non-specific and the details of the ST segment elevation become useful.
ST segment elevation with infarction will usually contain the following characteristics:- present in 2 or more anatomicaly contiguous leads
- often is flat and upsloping (as opposed to curved or concave upward), but can be upsloping as well
- will be associated with reciprocal ST depression in the "opposite" leads
- greater elevation of the ST segment (higher = higher probabilty of infarction). This finding was found to be statistically significant.2
Reciprocal ST depression:
Consider the following image of all 6 limb leads (precordial leads V1-6 not showing because they are in a different plane):
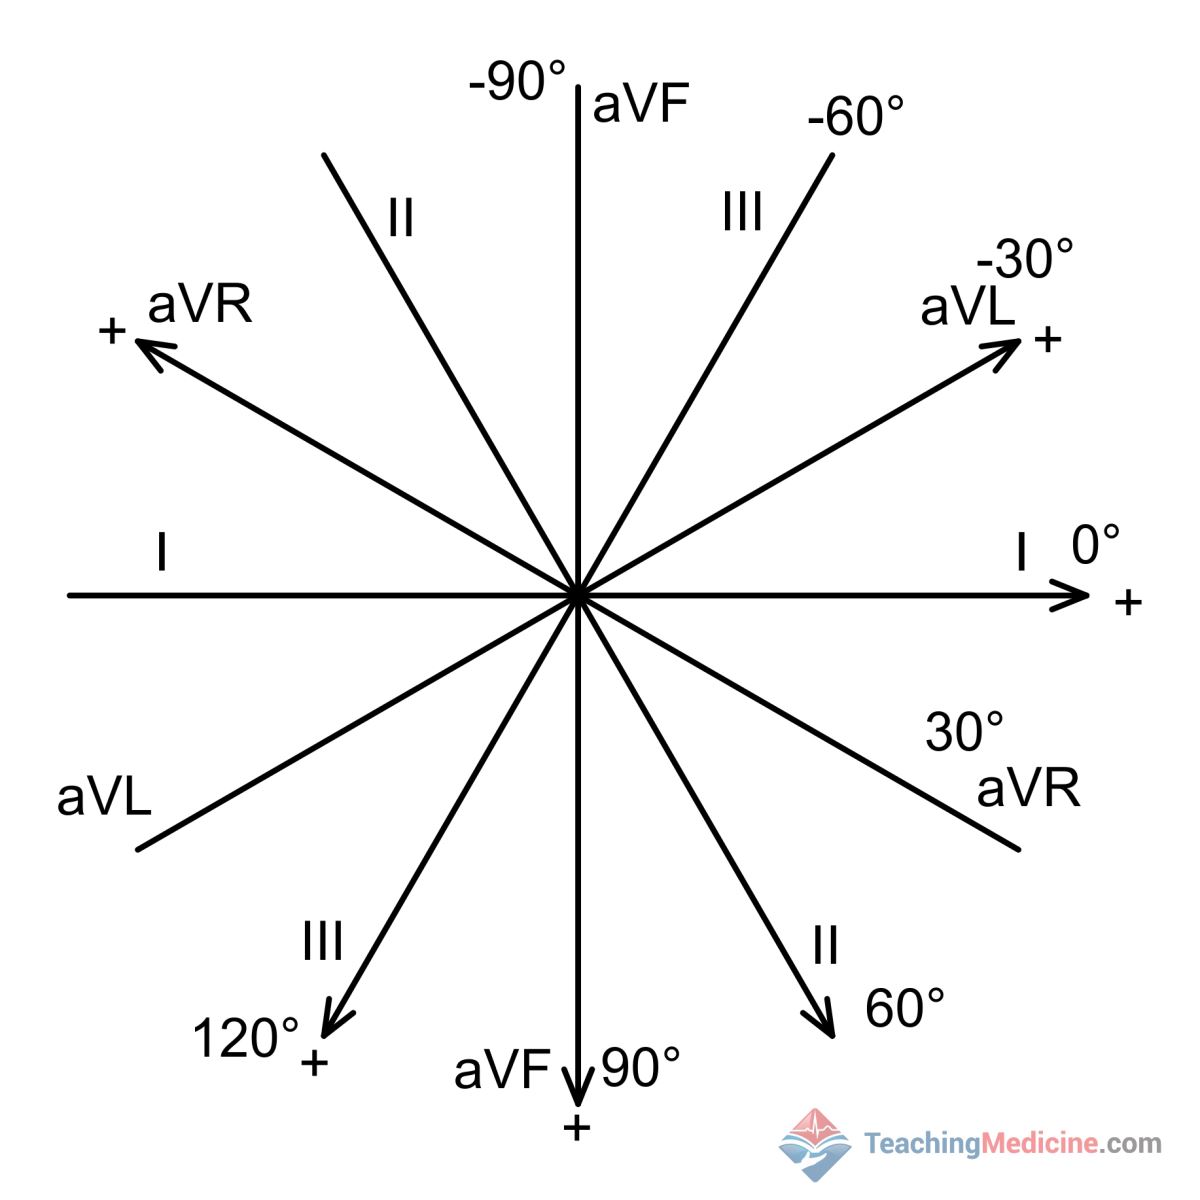
Notice that some leads are almost the reverse of others. For example, aVL (points to the top right quadrant) is nearly the opposite of lead III, which points to the bottom left.
If you saw an upward deflection in one of these leads, then the "opposite" lead would show the opposite: a downward deflection. This concept applies to ST segment elevation that is caused by a infarction. If one lead measures ST elevation from the infarction, then the "opposite" lead would show ST depression. When this happens, it is called a reciprocal change.
Here is an example of ST elevation in leads II, III, and aVF and reciprocal ST depression in leads I, aVL. Refer to the image above to compare how these leads are oriented compared to each other.
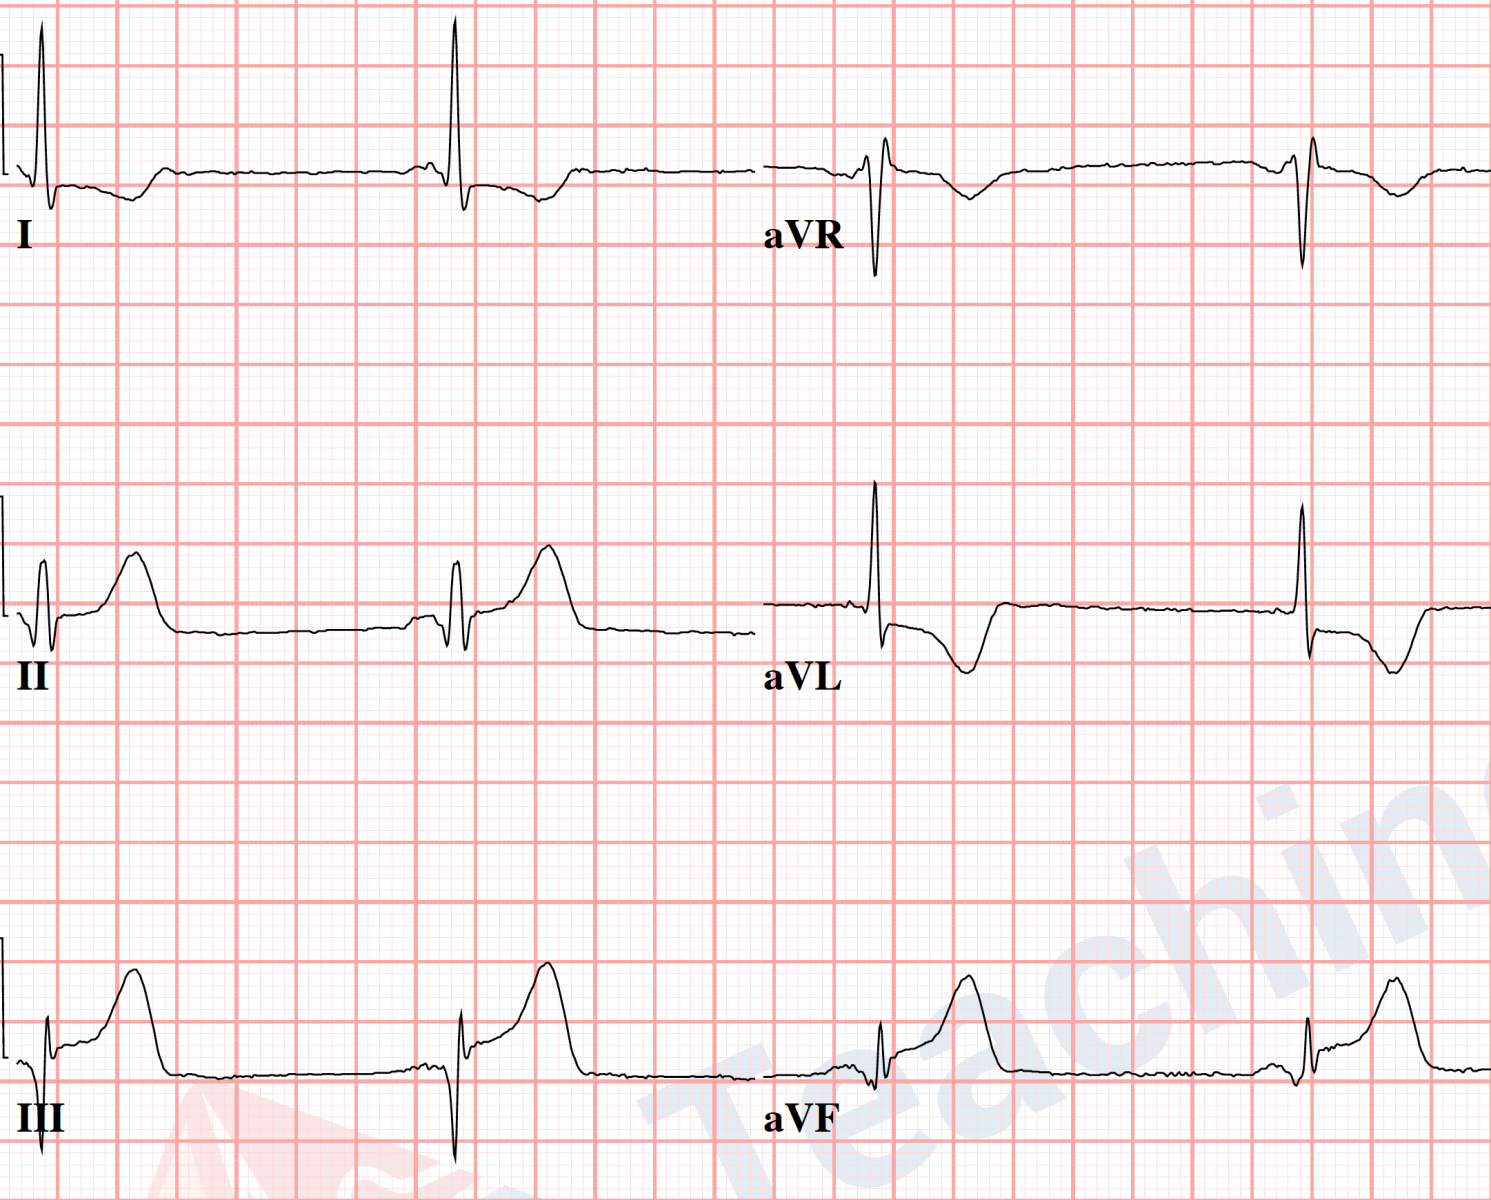
Why is this important? Infarction from one occluded vessel would produce a "regional" event within the heart. A process such as early repolarization, pericarditis, LBBB, or LVH would not a localized or regional process. Therefore, reciprocal changes do not exist for these diagnoses and therefore, when reciprocal changes are present, they are strongly suggestive of myocardial infarction, as opposed to a different diagnosis.
Peaked T waves:
Peaked T waves are commonly described with hyperkalemia.
Infarction peaked T waves: broad based and asymmetric
Hyperkalemia peaked T waves: narrow based and symmetric
Reduced R wave amplitude:
This finding has been found to be statistically significant in differentiating early repolarization vs. STEMI.2 In leads that are showing signs of infarction, we often see reduction of the height of the ECG because ischemia reduces the voltages generated inside the cells and the reduced voltage results in a smaller positive deflection on the ECG.
Q waves:
Q waves can be thought of as 100% reduction of the R wave, leaving no wave to start out the QRS complex, thus resulting in a Q wave starting out the QRS complex. This process of R wave reduction takes time; therefore, Q waves are not an initial finding in acute myocardial infarction and usually are seen within a few hours of the onset of the occlusion.
References:1. Wagner GS, Macfarlane P, Wellens H, et al. AHA/ACCF/HRS recommendations for the standardization and interpretation of the electrocardiogram: part VI: acute ischemia/infarction: a scientific statement from the American Heart Association Electrocardiography and Arrhythmias Committee, Council on Clinical Cardiology; the American College of Cardiology Foundation; and the Heart Rhythm Society: endorsed by the International Society for Computerized Electrocardiology. Circulation. 2009;119(10):e262-e270.
2. Smith SW, Khalil A, Henry TD, et al. Electrocardiographic Differentiation of Early Repolarization From Subtle Anterior ST-Segment Elevation Myocardial Infarction. YMEM. 2012;60(1):45–56.e2.
