Pericarditis is inflammation of the pericardium. This inflammation can influence the electrical properties of the epicardium (the outer layer of the heart), resulting in changes in the ECG.
Diagnostic Criteria:
The ECG undergoes 4 stages of evolution with pericarditis.
Stage 1 is the classic "acute pericarditis" description: - ST segment elevation in virtually all ECG leads
- ST elevation typically is curved upward (concave or scooped up)
- T waves concordant (same direction as) with ST segment elevation
- PR segment depression
- aVR shows the opposite: ST segment depression, and PR interval elevation
- (advanced detail) the ratio of J point elevation to T wave amplitude is > 25% in V5,6
Stage 2 (usually days after onset)- ST segment return to normal
- T waves can become flattened or inverted
Stage 3 (2-3 weeks after onset)Stage 4 (weeks to months)- ECG returns to original state
- some T wave changes could be permanent (if scar on pericardium develops)
Electrophyisiology:
The pericardium is in contact with both the atria and ventricles. Therefore, the inflammation of pericarditis will affect the electrical properties of both the atria and the ventricles. Repolarization seems to be affected the most (the P waves and QRS complexes are usually normal, but can sometimes be affected also).
Repolarization of the atria is typically not seen on the ECG as a wave. The space between the P wave (atrial depolarization) and the QRS complex is called the PR segment and is normally isoelectric (the last portion of the PR interval) is atrial repolarization.
The PR segment is the purple segment in the image below shows the region of atrial repolarization, not to be confused with the PR interval, which includes the P wave:
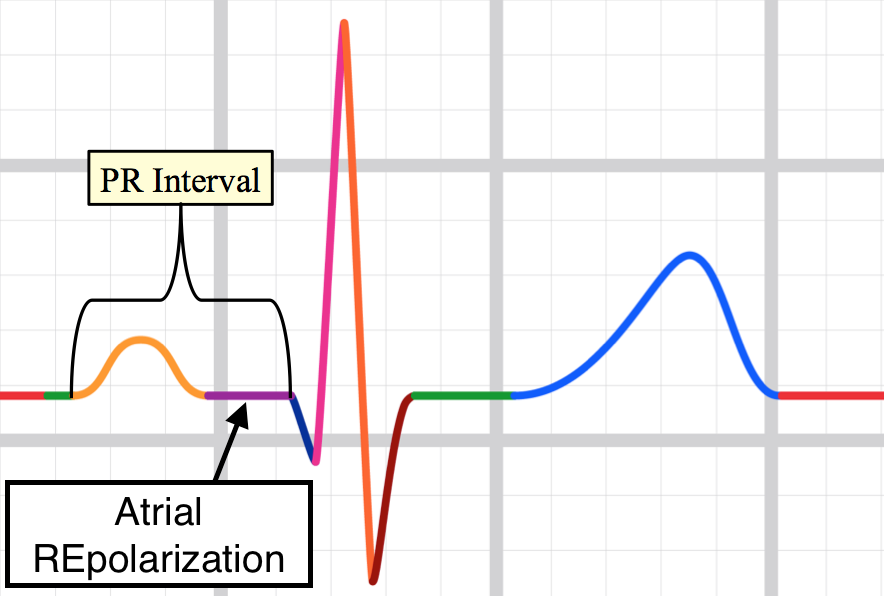
You probably have not thought about atrial repolarization too much because it does not create a waveform on the ECG.
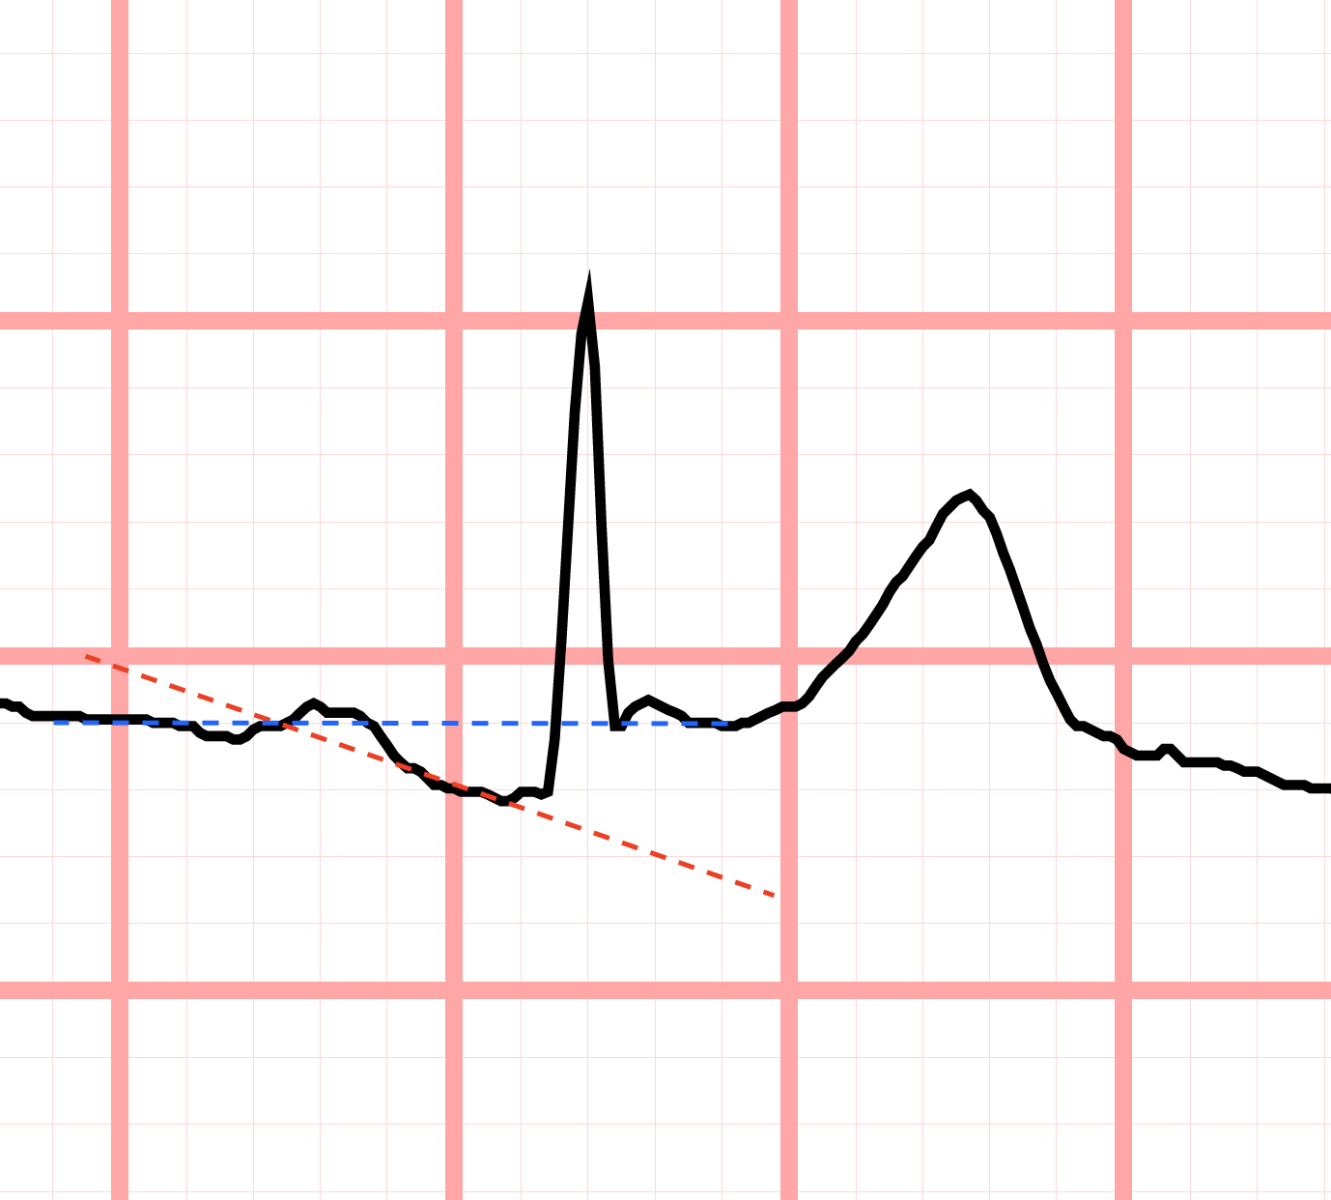
Abnormalities of atrial repolarization result in changes to the PR segment; the PR segment becomes depressed (below baseline) with pericarditis. This is called PR segment depression. It is usually downsloping. It occurs about 60% of the time in acute pericarditis.1 In lead aVR, the PR segment is elevated and upsloping (remember the ST changes are also reversed in pericarditis in aVR).
The blue dotted line indicates the isoelectric line. The PR segment is seen clearly below this line. The red dotted line shows downsloping of the PR inteval:
In the ventricles, the irritation of the epicardium (outer layer of myocardium) from the pericardial inflammation causes electrical abnormalities over the entire surface of the heart. These electrical abnormalities result in abnormal conduction and repolarization of the epicardium, resulting in changes to the ST segment.
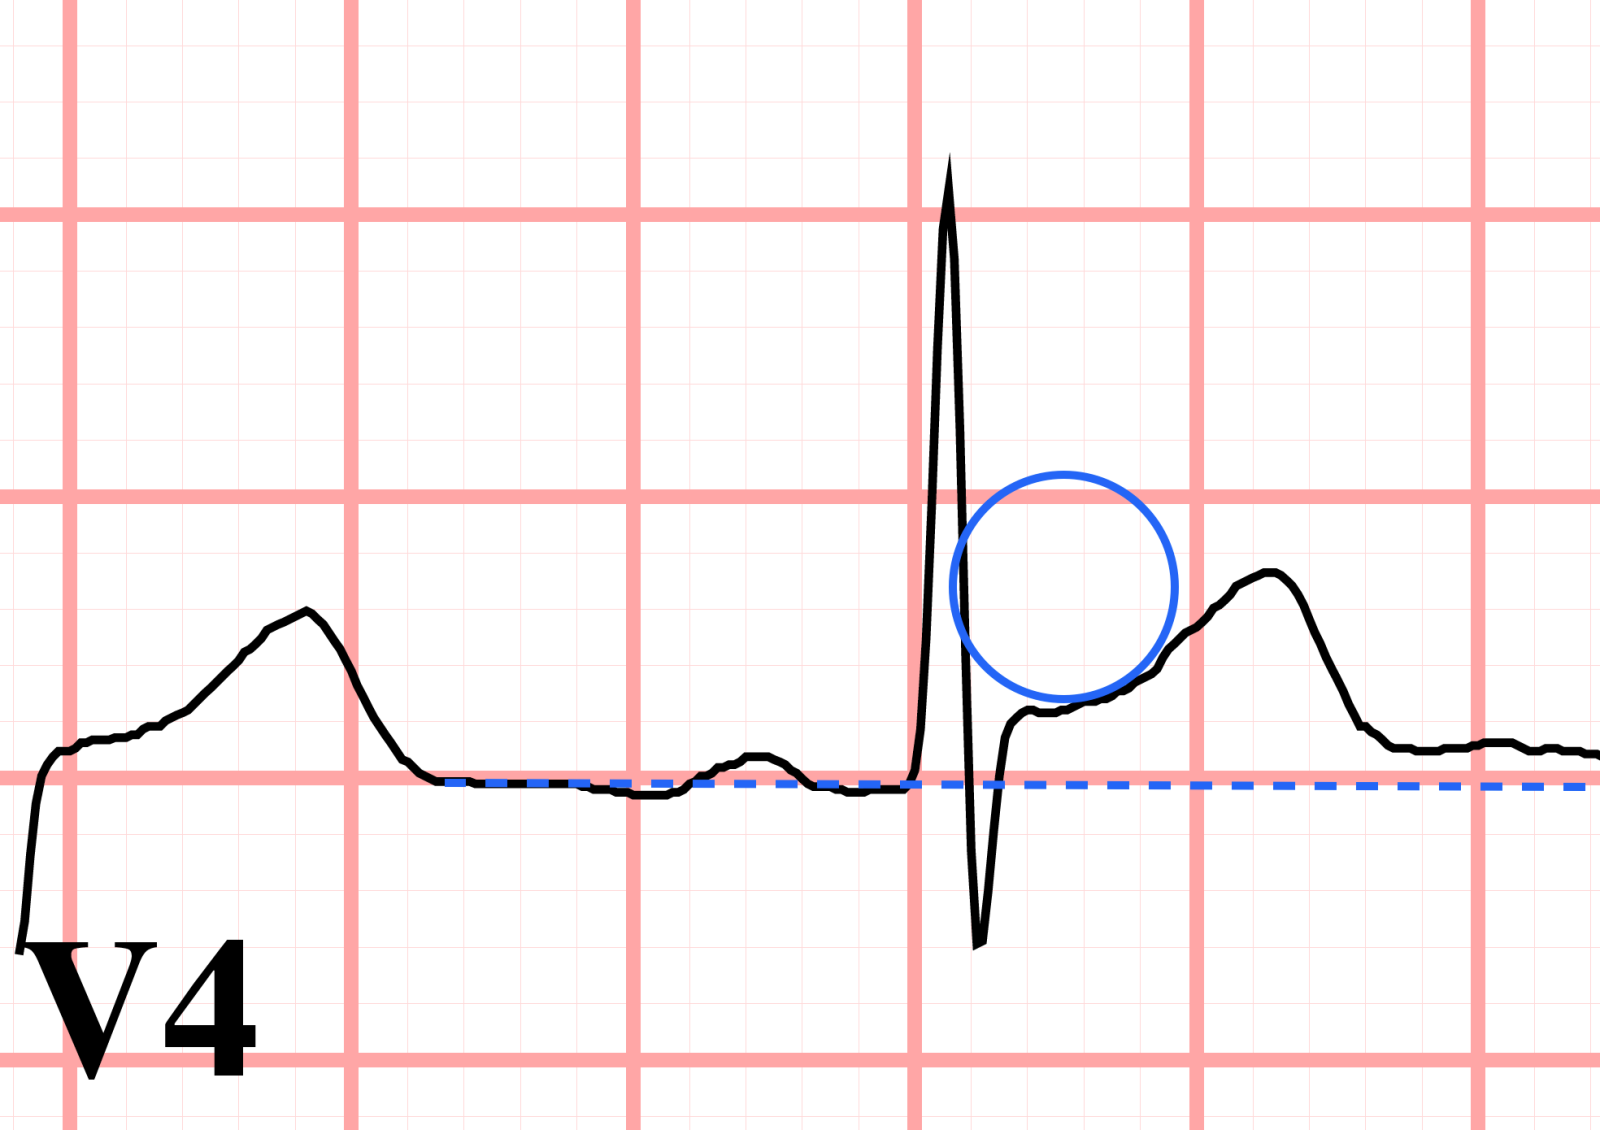
Normally, there is no current travelling during the ST segment (which is why it is isoelectric). However, the inflammation results in a current between the injured and non-injured myocardium, resulting in electrical activity traveling through the heart during the ST segment. This travelling current causes J point elevation and ST segment elevation. The ST segment elevation it usually not flat: it is curved upward, also called concave upward.
Here we see ST segment elevation in V4 and the ST segment is curved upwards, nearly matching the shape of the blue circle. The blue dotted line indicates the isoelectric baseline.
Clinical Significance:
Pericarditis has many causes, but is often idiopathic (no cause identified). The most common causes include:- viral
- myocardial infarction
- after injury to the myocardium (cardiac surgery, trauma)
- other infections
- radiation
A detailed list of causes of pericarditis can be found in the reference paper.1
ST segment elevation from pericarditis could be mistaken for ST segment elevation due to other causes:- early repolarization
- myocardial infarction
- LVH with repolarization abnormality (formerly called strain)
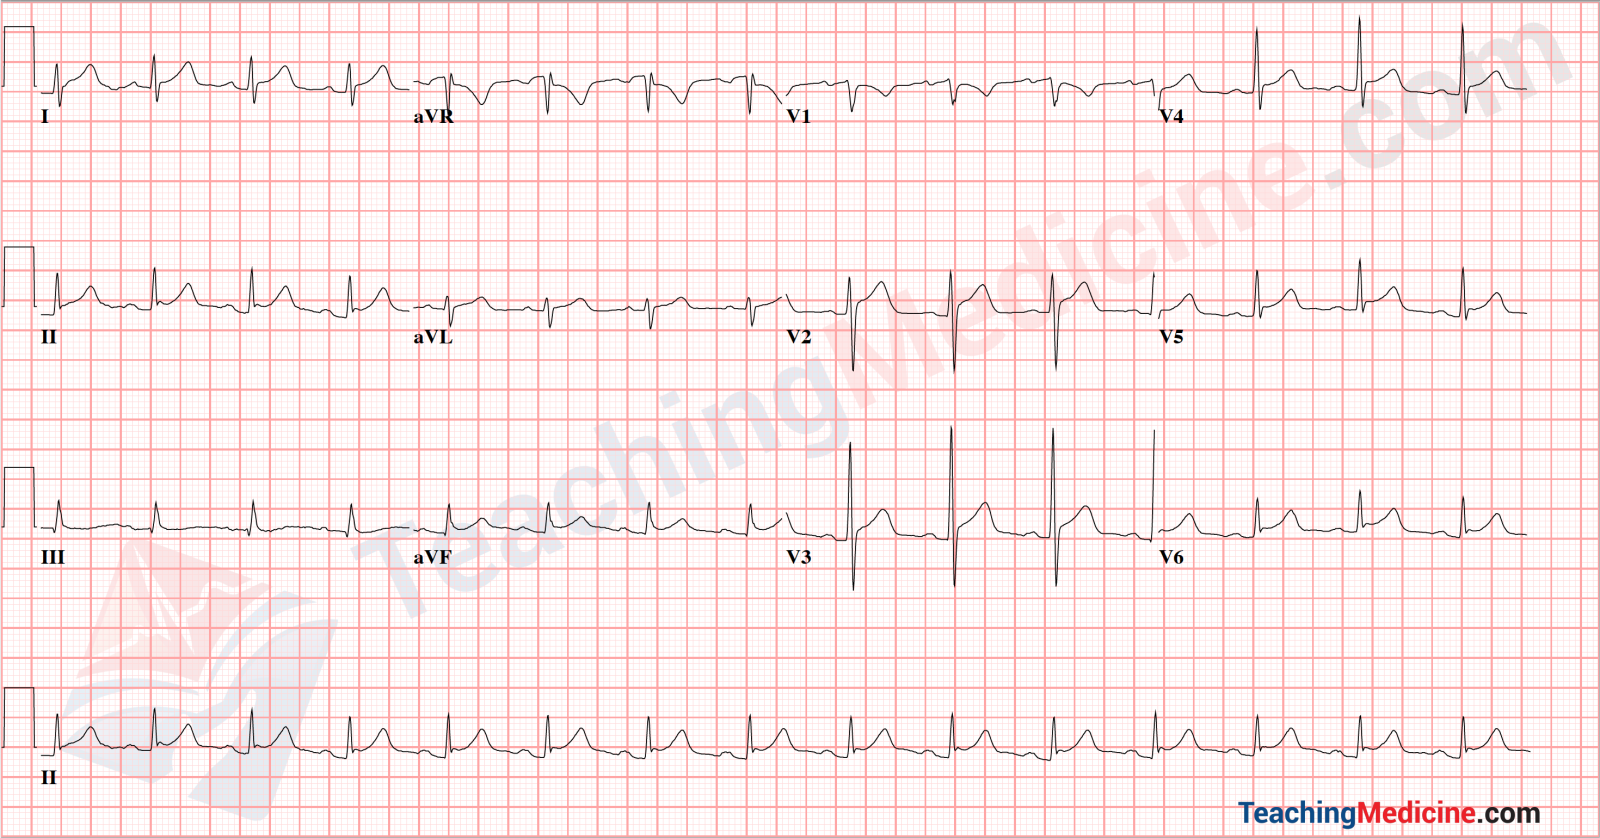
Example:
Can you see: ST segment elevation (curved up) in all leads except aVR and V1, PR inteval depression that is downsloping in most of the leads and aVR not obeying the rules and showing: PR inteval elevation which is upsloping and ST segment depression. V1 is also showing PR interval upsloping and ST segment depression. For extra money, can you confirm the J point elevation in V5/6 is more than 25% of the height of the T wave?
References:1. Ariyarajah V, Spodick DH. Acute Pericarditis. Cardiol Rev. 2007;15(1):24-30. doi:10.1097/01.crd.0000210645.89717.34.
2. Spodick DH. Diagnostic Electrocardiographic Sequences in Acute Pericarditis. Circulation. 1973;48(3):575-580. doi:10.1161/01.CIR.48.3.575.
